
Dataset creation, data upload, data download and display*
*partial transcript of the videoclip** available on the DYDAS channel
**held by Lorenzo Di Giacomo
Welcome to everyone to this series of webinar to about the DYDAS platform!
This is the first of four webinar that will explain how to work with data using DYDAS platform and, in particularly today, we are going to see:
- What is data?
- What is DYDAS?
- Which kind of data DYDAS handle?
- How to upload and/or download them, and view them in the digital platform.
So, let’s start with a briefing to the introduction of DYDAS (DYnamic Data Analytics Services): it is a project co-financed by Connecting Europe Facility, CEF-TELECOM, European Programme. It aims to create a big data platform for handling geospatial data providing the user the ability to upload their own data to work with them and giving access to the user to a set of tools for modeling those data and also the ability (this feature is still only planned in the future) to exchange them and sell them on the marketplace as well as also work with the user own code written in Python and that will be executed inside the HPC infrastructure of DYDAS.
In the preview it is possible to see the main page to entrance in DYDAS:
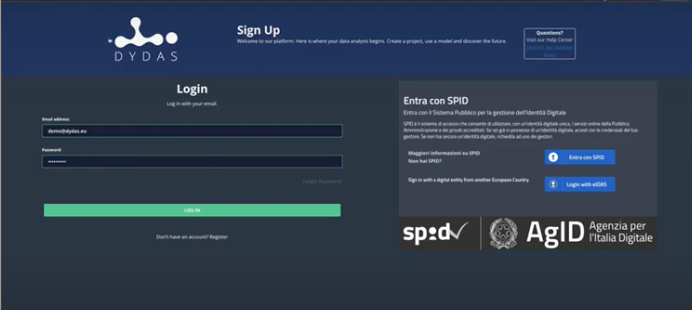
It is accessible to the public and there is the login page and from here you can register your own account. Of course, I still have one and it’s a simple registration flow so you can go through here and you can register yourself.
So, let’s go back and once you have finished the registration process you can access the platform, then once you have entered your credentials the following screen shows the main page which offers an overview of all the projects started by the user and all the operations performed.
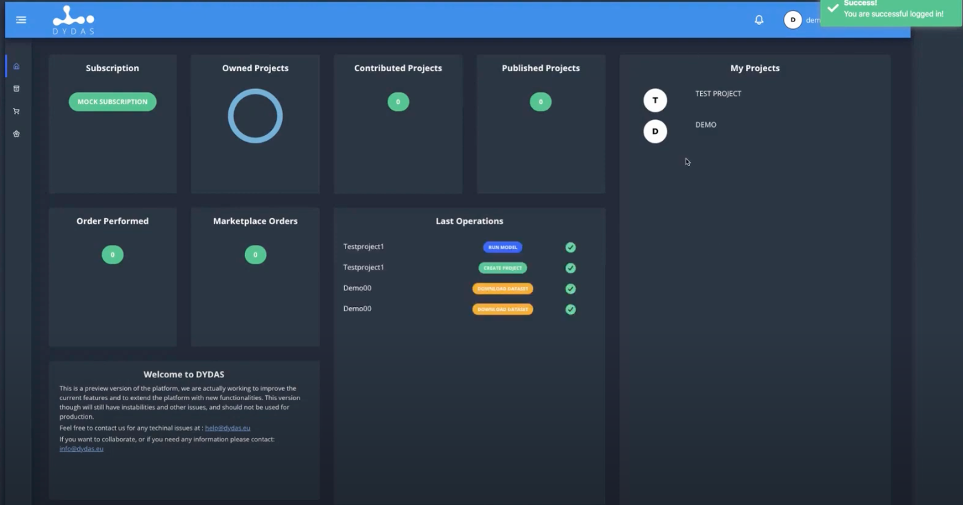
In the case in question, we find a project in progress with a project ID and a demo. And it is possible to see also other metrics related to the actions of Published project” the “Contributed project” but we’ve seen them later when, in the other webinars, we’ll talk about the marketplace and the models.
What we are going to see today is the projects’ part, so as you can see you have a Workspace and Project. In the workspace-section you can actually:
– edit project; – create new ones; etc.
On “Project-section” it is possible to have just an overview of your project and get the first information. While in the Workspace-section you can work through “edit” bottom for start working with a project. But let’s create a new one:
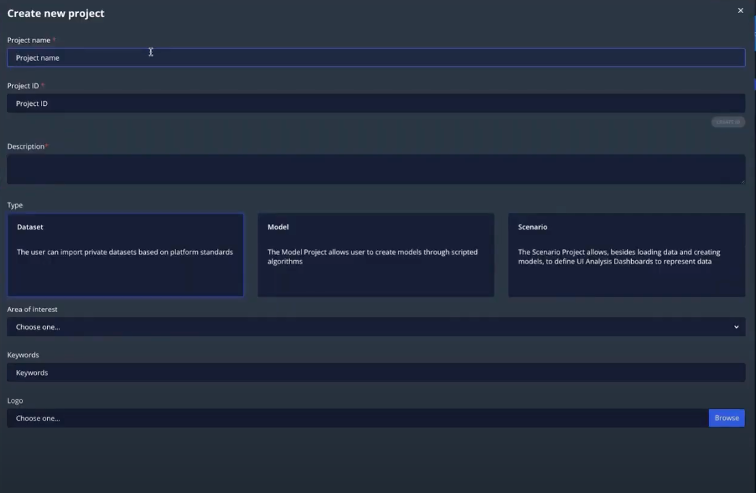
We’re going to call it, for example “demodydas”, and automatically a project ID is generated. It is possible to add a short description and then is required to choose between 3 types of projects: – Dataset; – Model; – Scenario.
Under Dataset-section it is possible to import dataset and download them and fast view them but you don’t have access to the models for edit and for run your own code on the HPC infrastructure of DYDAS.
Inside the Model-section is possible to work with your own algorithms in the HPC infrastructure but you can’t actually import data or that dataset.
Instead, under the Scenario-section you have the both of the sections described before, so, you can upload your dataset, you can view them in the dashboard and you can also run your own code. Since this last section is the most complete since it contains the other two previous sections, in this tutorial we select this last section and move on.
The next choice option (not mandatory) in the DYDAS platform form, is dedicated to selecting the “area of interest” (i.e. Administrative units; Cadastral parcels; Coordinate reference systems; Geographical grid systems; Geographical names; Hydrography; Protected sites; Land cover; etc,).
Also, the keyword is asked from the system to choose keywords. You can insert your own keyword and this will be used for uh in the indexing your project inside the “marketplace” (area were are allocated all the project published), and also you can choose a logo that basically is an image for the project (but those are not required).
Each operation carried out will be notified by the system as it happens in the case of completion of the new project just carried out.
The new project is ready to be used. Then It is possible to start completing the details of this project.
By clicking on the new Project, you enter the Menu of the single project:
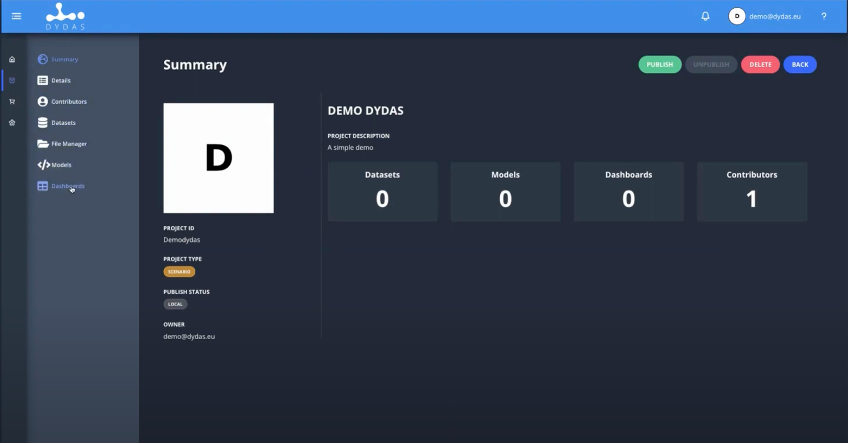
So, let’s start writing this project and as you can see, we have other fields those describe the project metrics, it is basically an overview of all the dataset models dashboard. It is also possible to see the number of contributors, if there are other people that work under this project. And also, the project type information, the status, if it is published or not, and you can edit some of those information.
The descriptive elements of the Project can be modified and updated while the project ID cannot be changed of course.
In the “Contributors” page, a respective email can be added to the collaborators envisaged for the project. I can just put their email in the appropriate section and a request will be sent via email and can be accepted and in case they’re registered there will be just added in the same project and they can start edit within this project but if they’re not registered on the DYDAS platform, it will be required.
In the section “DATASET” is possible to simply create a new dataset, or, I can also search for open dataset. There are datasets that are already in the DYDAS platform and are available to the public to be imported by the users through a click on a button and once we import the dataset, we can simply work with them in the model-section. When a dataset is imported, we can only read them but we cannot edit them. But we’ll see that when we talk about the marketplace in a next webinar.
What I want to do here is to add a new dataset here and we can choose a name, for example since I got some data that we will be upload I know that this dataset contains “Italy regions” and as soon as we type this text, a Dataset ID is automatically generated. It is possibl also to add an image refereed to the dataset. We can complete the section “Description” in this case “Italy regions vector data”, and after that we meet the section related to the “license”. Of course, we have to choose between different licenses and we are going to use “Apache license” you can also change the name and upload your own license but we’re not going to do that we’re just using Apache license.
After that, the important part is to choose the “Typology”, basically it is referred to the typology of the data, this meaning that we can have, inside the platform, different kind of data, i.e., geospatial data (which contains geographical references or spatial coordinates, and they can be in vector or raster images, etc.);
the typology Timeseries is referred to data that contain information about the time but they don’t have information about the Geography, for example, if we are working with IoT devices that are placed – for example – around the city and we know the positions it’s a static of each device maybe we don’t need the special information since we already know where each device’s device for uh with the with their ID we can know a position so basically we can just use time series in case we want to take the sensor information from each device and upload it here. Instead, if we want to have both information and our data will contain both information: geospatial and timeseries we can of course select the option “GeospatialTimeseries” typology. While if we don’t have geospatial data neither Timeseries we can simply use the “simple” typology selection, if we have data i.e., in an Excel file.
In this tutorial I upload a vector file, so I choose “geospatial” typology and about the “attributes” is referred to what properties you will upload in this dataset – this is one of the most important parts creating a dataset, because you cannot delete or add new attributes once the dataset is created. Basically, you can create columns for relational database.
I’m gonna show you an example, I want to upload a Json (JavaScript Object Notation) file:
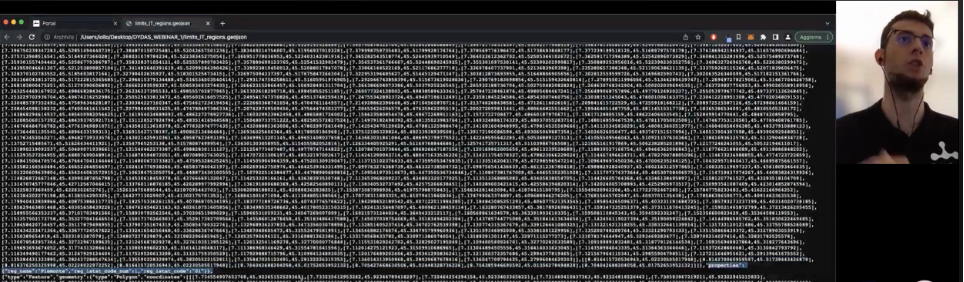
(in the image above you can see feature coordinates) it’s a vector file and the coordinates refers to the geography properties.
It is possible to insert all the other desired properties, for example in our current example, we insert the name of the region and this field is recognized for the string, because the text is preceded and concluded by quotation marks.
Once all the properties of a dataset have been declared, it is possible to choose a style, between “default” and “custom”. After that there are some non-mandatory options, such as “Tags”, however useful for simplifying the data search activity on the platform. The system already offers a list of keywords. “References Area” and “Referenced Volume”, where it is possible to indicate the amount of data entered.
At the end of the procedure, the system will return a success signal of the dataset added to the platform. At this point you can further choose: the “download” of the data; the “upload data”; “Edit dataset” to add or modify some previously entered information.
To upload, it is possible to choose between a zip file, once the specific file is selected, the system will ask what format the zip contains, for example in our case GeojSON or Shapefile (for vector files), etc. ; you can specify the type of design, in our case EPSG:4326. Finally, you can select the insertion mode:
- Append (to enter data starting from scratch)
- Insert (to enter specific data and specific cases)
- Overwrite (for an update of data with respect to already existing and entered data).
We will get a preview of the situation with the entered data, in our case for example (see image below):
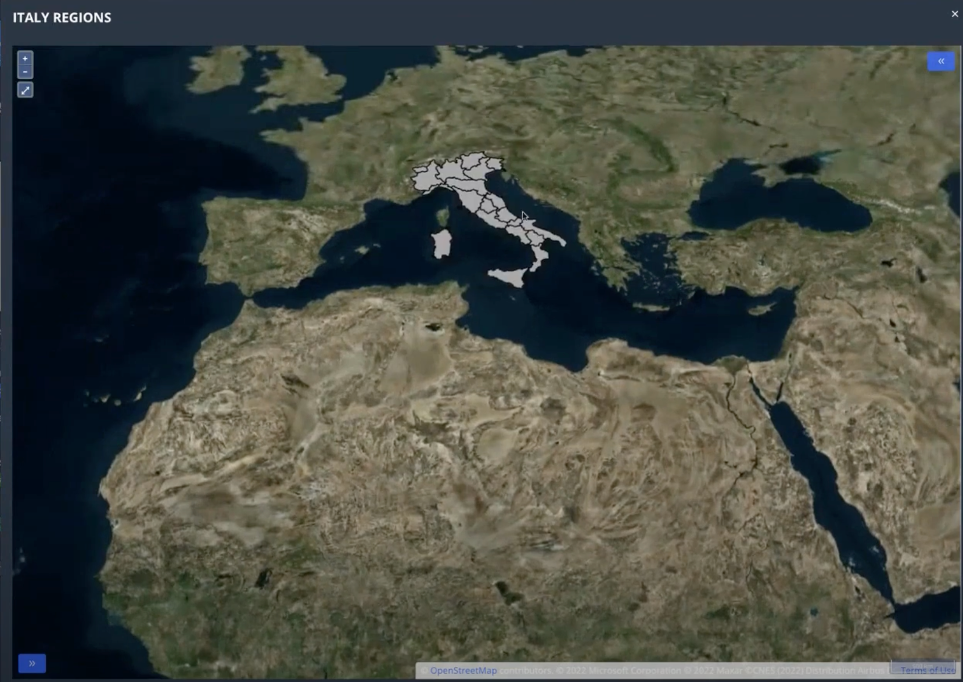
(to continue learning it is possible to view the entire videoclip from the minute 24:00) LINK.
Thank you very much for your attention and see you in the next episode!