
by Matteo Picchiani, PhD GMATICS
As part of the Use Case Maritime for DYDAS platform’s test, GMATICS, in collaboration with ENEA, has developed two Artificial Intelligence models of forecast of the sea state, the AI MITO and the AI WAVE models. The AI implementations were developed to reproduce the accuracy of the state of art MITO and WAVE physical forecast models in a fraction of running time required to perform the models execution over the whole Mediterranean basin. More specifically, the predictive variables that have been considered are:
for the MITO model
- Eta (Sea Surface Height)
- S_srfc (Surface Salinity)
- T_srfc (Surface Temperature)
- U_srfc (Surface Wind U-component Speed)
- V_srfc (Surface Wind V-component Speed)
for the WAVE model
- hs (Total Significant Wave Height)
- tp (Total Peak Period)
- tmp (Total Mean Period)
- thq (Total Mean Wave Direction)
An external DYDAS WebGIS platform linked with the DYDAS platform has been developed by GMATICS in order to provide an interactive and a very powerful real time data analysis.
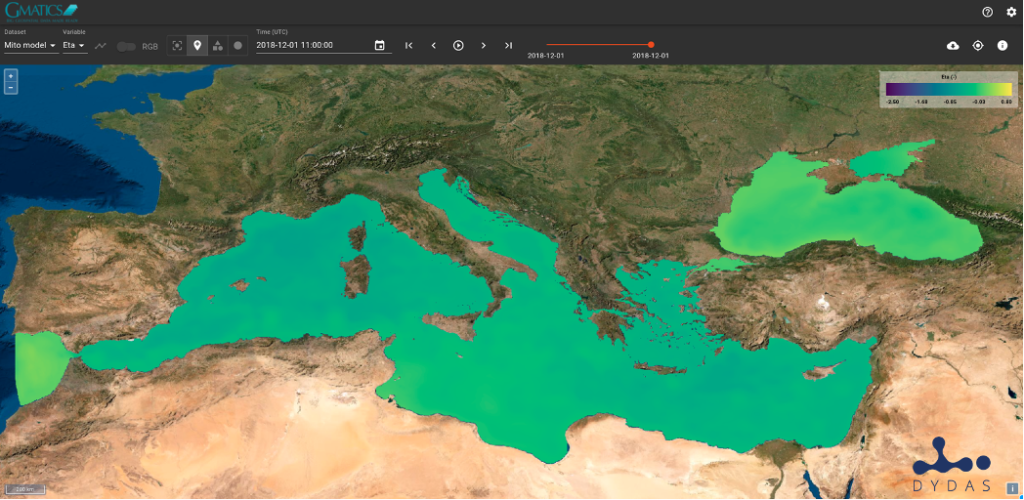
The user interface provides a support to visualize the various information layers allowing an easy interaction with the data both in terms of geographical and temporal coverages. The implementation is based on a WebGIS structure that provides also several advanced functionalities to perform a live analysis of the data and metadata. The main interface of the DYDAS external WebGIS Platform is shown in the figure below.
The platform ensures the possibility to compute on-the-fly diagrams by accessing the temporal stacks of data stored, also including the possibility to perform multiple plots for investigating the variation in time and/or space of different variables at a given geographical point or over a specific area.
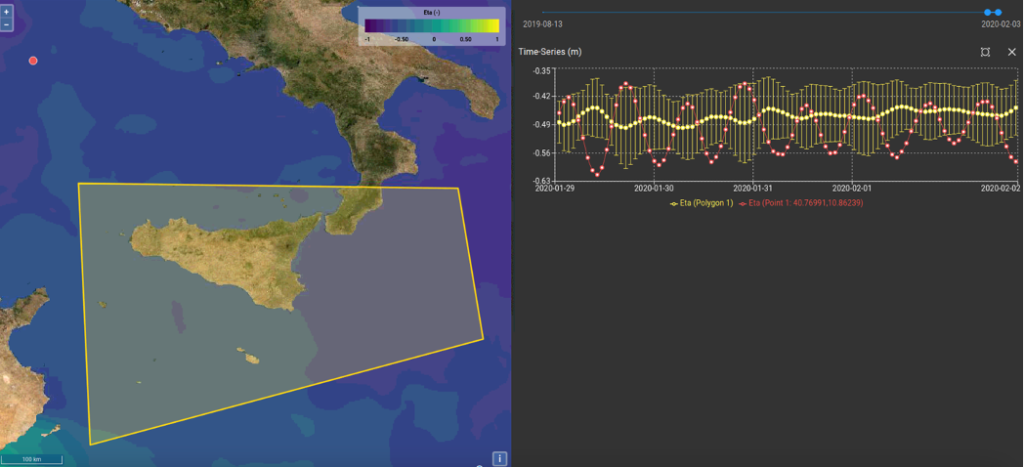
An example of the functionalities of the DYDAS external WebGIS platform is reported in the following figure, that shown two time series: the red one refers to the red point shown in map, the yellow one refers to the yellow polygon and it shows the real time computed max, min and average values.
Un esempio di piattaforma digitale per la visualizzazione di dati applicata al caso d’uso DYDAS “Maritime“
a cura di Matteo Picchiani, PhD GMATICS
Nell’ambito del test della piattaforma Use Case Maritime for DYDAS, GMATICS, in collaborazione con ENEA, ha sviluppato due modelli di Intelligenza Artificiale di previsione dello stato del mare, i modelli AI MITO e AI WAVE. Le implementazioni aia sono state sviluppate per riprodurre l’accuratezza dei modelli di previsione fisica MITO e WAVE all’avanguardia in una frazione del tempo di esecuzione necessario per eseguire l’esecuzione dei modelli su tutto il bacino del Mediterraneo. Più specificamente, le variabili predittive che sono state considerate sono:
per il modello MITO
- Eta (Altezza superficie mare)
- S_srfc (Salinità superficiale)
- T_srfc (temperatura superficiale)
- U_srfc (Velocità componente U del vento di superficie)
- V_srfc (Velocità del componente V del vento di superficie)
per il modello WAVE
- hs (Altezza totale significativa dell’onda)
- tp (Periodo di picco totale)
- tmp (Periodo medio totale)
- thq (Direzione totale media dell’onda)
Una piattaforma DYDAS WebGIS esterna collegata alla piattaforma DYDAS è stata sviluppata da GMATICS al fine di fornire un’analisi dei dati interattiva e molto potente in tempo reale.
L’interfaccia utente fornisce un supporto per visualizzare i vari layer informativi permettendo una facile interazione con i dati sia in termini di coperture geografiche che temporali. L’implementazione si basa su una struttura WebGIS che fornisce anche diverse funzionalità avanzate per eseguire un’analisi in tempo reale dei dati e dei metadati. L’interfaccia principale della piattaforma WebGIS esterna DYDAS è mostrata nella figura seguente.

La piattaforma garantisce la possibilità di calcolare diagrammi on-the-fly accedendo alle pile temporali di dati memorizzati, includendo anche la possibilità di eseguire più grafici per indagare la variazione di tempo e/o spazio di diverse variabili in un determinato punto geografico o su una specifica area.
Un esempio delle funzionalità della piattaforma WebGIS esterna DYDAS è riportato nella figura seguente, che mostra due serie temporali: quella rossa si riferisce al punto rosso mostrato nella mappa, quella gialla si riferisce al poligono giallo e mostra i valori max, min e medi calcolati in tempo reale.
