When training a Machine Learning or Deep Learning model, a crucial phase is evaluation. It consists of measuring how well the model is capable of yielding the expected results in terms of prediction. The dataset is usually divided into three sets: train, validation and test. The first one is used for training, the second one for monitoring how well the model is learning during training, and the last one for evaluation.
So, which are the criteria for judging whether a model is good?
It depends on the type of task the model performs. Below are some metrics used for classification tasks.
A classification model takes a specific data input and returns a classification category: a typical example is the spam-ham classifier that recognises spam e-mails from normal e-mails.
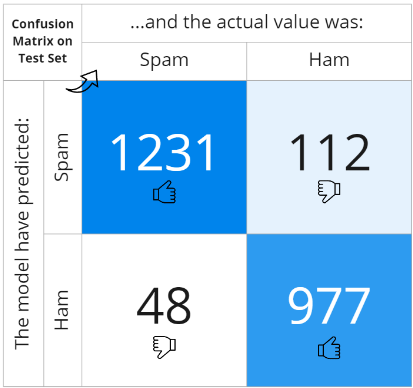
To assess the quality of performance, the following metrics are usually used: Confusion Matrix, Accuracy, Precision, Recall and F1 Score. The confusion matrix is a square table in which the rows represent the classes predicted by the model and the columns represent the actual classes. The matrix is filled with a count of all observed cases: correctly matched and misclassified records.
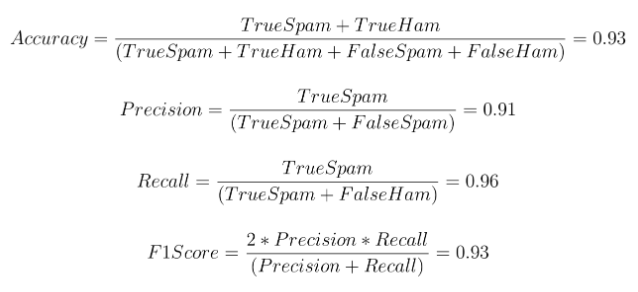
Thanks to the confusion matrix, all other metrics can be extracted: Accuracy gives the percentage of correctly classified records out of the total, Precision is the ratio of correctly predicted positive observations to the total predicted positive observations, Recall indicates the ratio of correctly predicted positive observations to the all observations in actual class and F1 Score gives the weighted average of Precision and Recall, taking both false positives and false negatives into account. The closer the indices are to the unit value, the better the classifier performs.
This article has been written by Giovanni Nardini – R&D Artificial Intelligence Lead