
Partial transcript of the Fourth and last Webinar on “How to use the DYDAS platform”, held by Lorenzo Di Giacomo, Big Data & Software Engineer.
Welcome to everyone at this last webinar of DYDAS platform. Today we’re going to see:
- how to work with dashboard
- how to configure them to see inside information of your own data
As shown in the previous webinars we make the login to the platform then we go to “workspace” to see our “edit” section of our projects and we can click in the dashboard panel. A dashboard is a set of widget that can be configured to show information of project dataset via Charts, Maps, etc.
We can see a tab editor, and, in the right side, we have a list of all available widget of DYDAS platform.
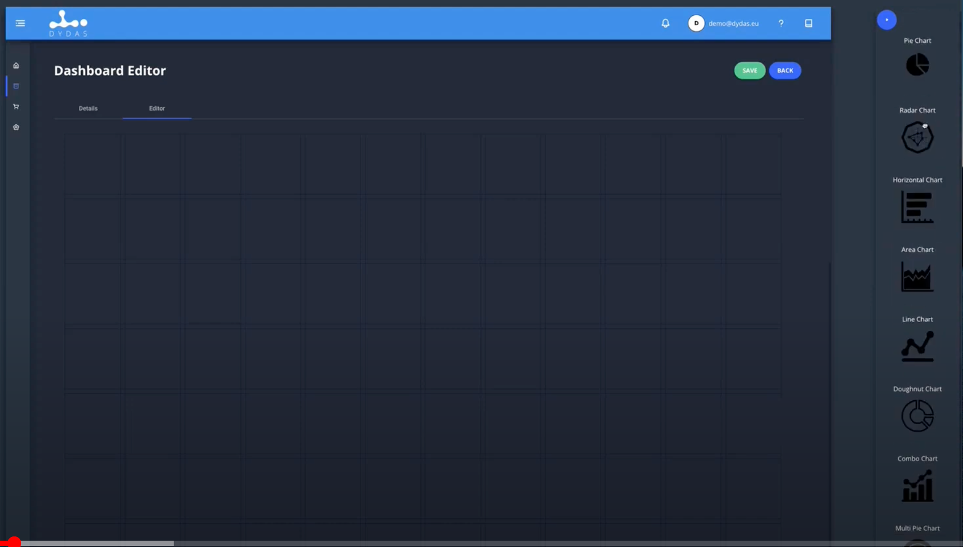
We can start using Drag&Drop method, to move the widgets that interest us on our dashboard, for example a Map and a Diagram chart.
We can also move and edit and choose the size of these elements selected as we have plenty space here to work with all the widgets that we want.
Let’s start with a simple map, clicking on the image of the map, a drop-down menu appears a and we choose a dataset, for example “Italy regions” that we have had already used in other lectures and now we have to choose the layer type. In our case we just want to use the standard and we can edit the area to visualize our data
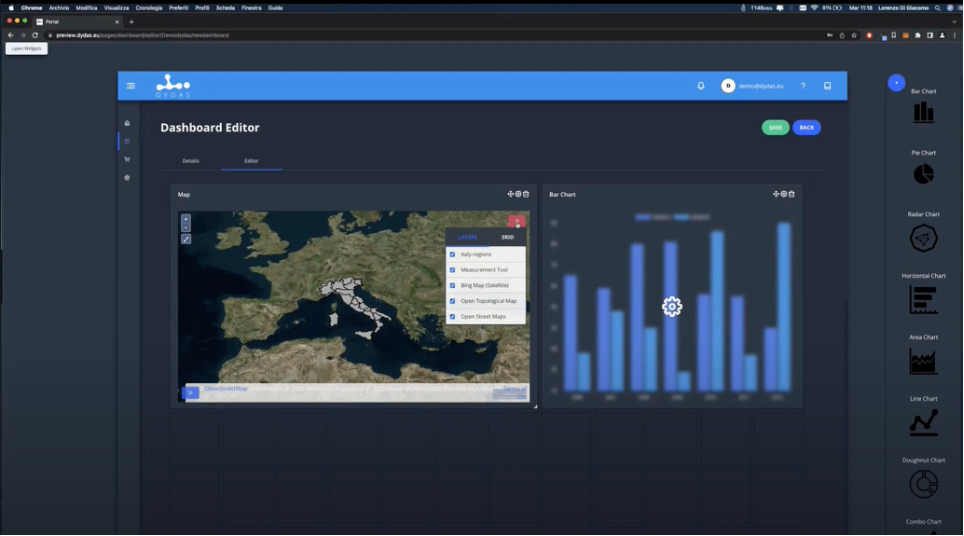
And we can add other layers, in our case we just have: “Italy-regions”, “Measurement tool”, “Bing Map (Satellite)”, “Open Tipological Map”, “Open Street Maps”, and we can add a new one like “Wind farms”. Each layers contains their information we can analyse.
Continue to follow the explanation on how the DYDAS platform works on the YouTube channel
Experience directly the DYDAS digital platform for the analysis of large amounts of data
Further information: www.dydas.eu | info@dydas.eu | @DYDASEU | LinkedIn DydasEU2020
Quarto episodio su “Come utilizzare la piattaforma DYDAS” (finale)
Trascrizione parziale del Quarto ed ultimo Webinar su “Come utilizzare la piattaforma DYDAS”, tenuto da Lorenzo Di Giacomo, Big Data & Software Engineer.
Benvenuti a tutti in questo ultimo webinar della piattaforma DYDAS. Oggi vedremo:
- come lavorare con la dashboard
- come configurare la dashboard per vedere le informazioni di interesse relative ai dati
Come mostrato nei webinar precedenti dopo avere effettuato il login alla piattaforma DYDAS possiamo recarci nell’area di lavoro “workspace” per vedere la nostra sezione “modifica” relativamente ai nostri progetti e possiamo cliccare nel pannello dashboard. Una dashboard si caratterizza per l’insieme di widget che possono essere configurati per mostrare le informazioni circa il set di dati del progetto tramite, per es. grafici, mappe, ecc.
Possiamo vedere un editor di schede (“tab editor“), e, nella parte destra, abbiamo un elenco di tutti i widget disponibili della piattaforma DYDAS.
Possiamo iniziare ad utilizzare il metodo Drag&Drop (cliccare su un oggetto virtuale per trascinarlo in un’altra posizione), per spostare i widget che ci interessano sulla nostra dashboard, ad esempio, per la nostra esercitazione, scegliamo di inserire nella Dashboard, una Mappa ed un Grafico Diagramma.
Possiamo anche spostare, modificare e scegliere la dimensione di questi elementi selezionati poiché qui abbiamo molto spazio per lavorare con tutti i widget che vogliamo.
Partiamo da una semplice mappa, cliccando sull’immagine della mappa, appare un menù a tendina e scegliamo un dataset, ad esempio “Regioni Italia” che abbiamo già utilizzato in altre lezioni e ora dobbiamo scegliere la tipo di strato. Nel nostro caso vogliamo solo utilizzare lo standard e possiamo modificare l’area per visualizzare i nostri dati:
E possiamo aggiungere altri layer, nel nostro caso abbiamo per es.: “Regioni-italiane”, “Strumenti di Misura”, “Bing Map (Satellite)”, “Mappa Tipologica Aperta”, “Open Street Maps”, e possiamo aggiungere un Livello nuovo come ad es. “Parchi eolici”. Ogni livello conterrà le informazioni da analizzare.
Sperimenta direttamente la Piattaforma digitale DYDAS per l’analisi di grande mole di dati
Ulteriori informazioni: www.dydas.eu | info@dydas.eu | @DYDASEU | LinkedIn DydasEU2020